
Debug Analyzer.NET
What is Debug Analyzer.NET?
Debug Analyzer.NET is a debugging automation tool to analyze memory dumps using analysis plug-ins written in .NET!
It has several other features to make your debugging life easier and pleasant. It also takes advantage of Wisdom of Crowd to enhance the analysis capabilities.
In other words, if you have used windbg + sos/psscor and ever wondered about automating debug analysis, Debug Analyzer.NET is for you!
Core Features:
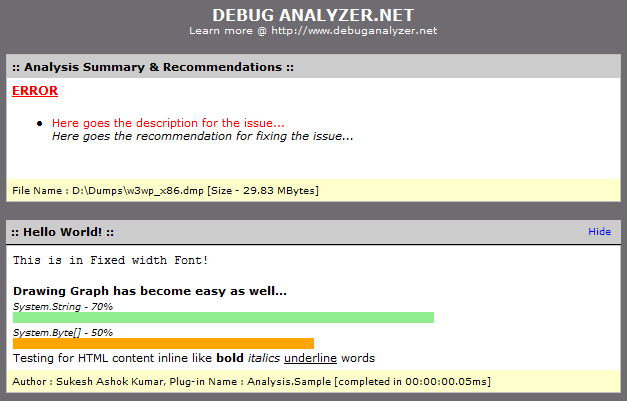
- Analysis Reporting : Write .NET based Plug-in to run analysis against a well defined Object Model to generate html reports
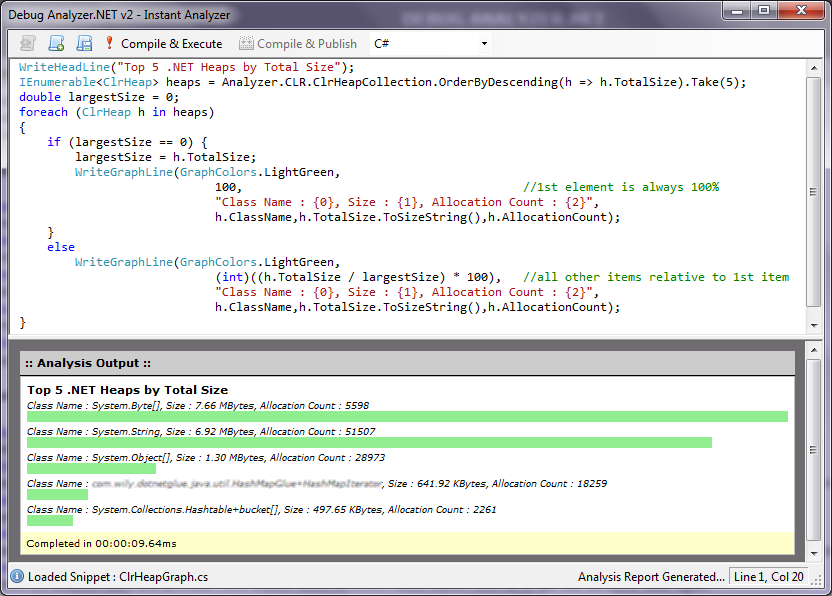
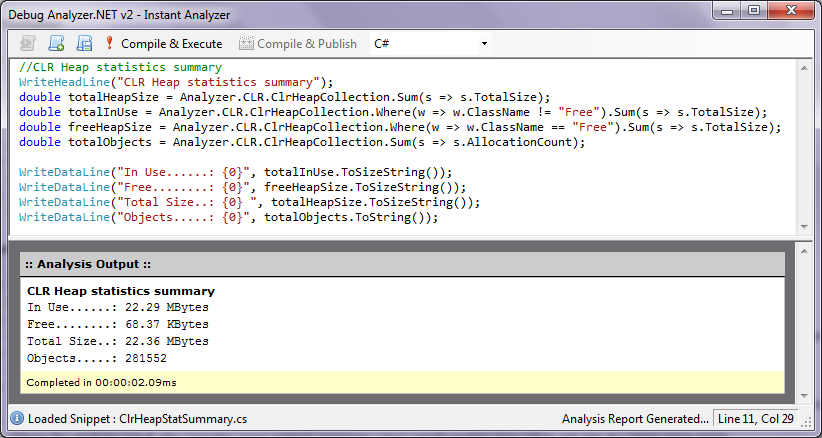
- Instant Analyzer : Write your analysis code in Code Editor and hit F5 to compile and execute your analysis so that you can see the results instantly.
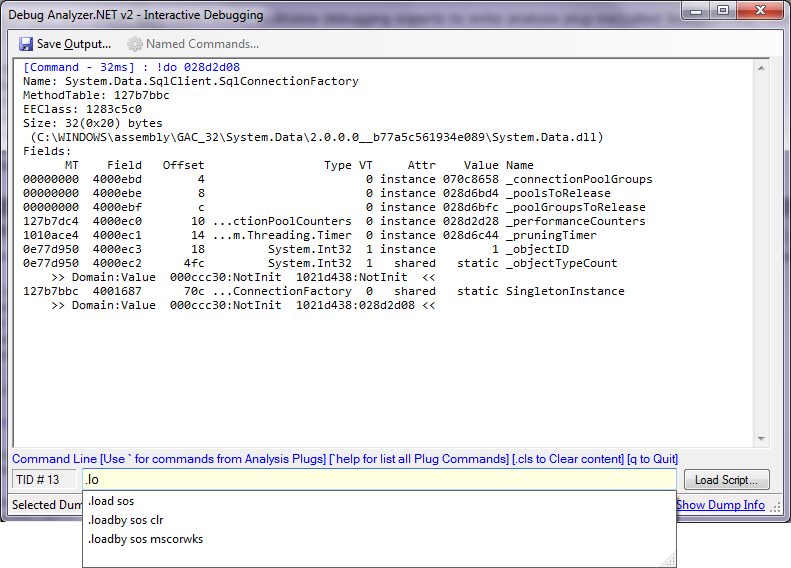
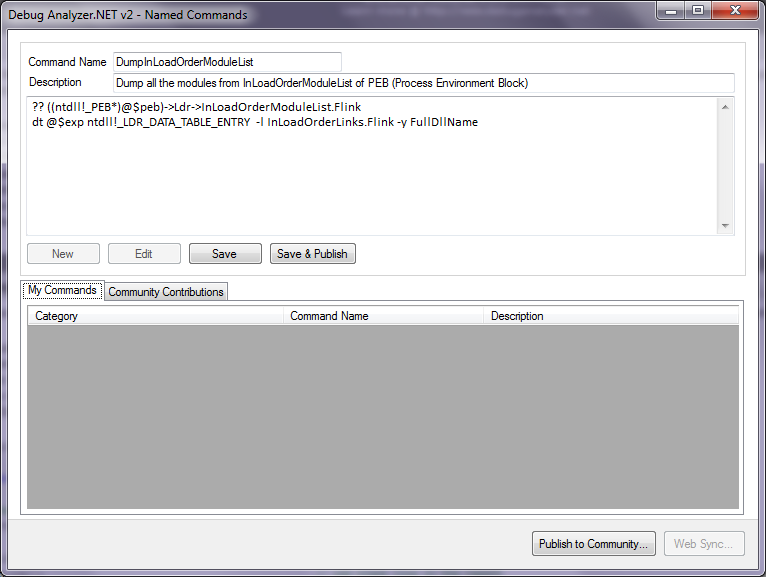
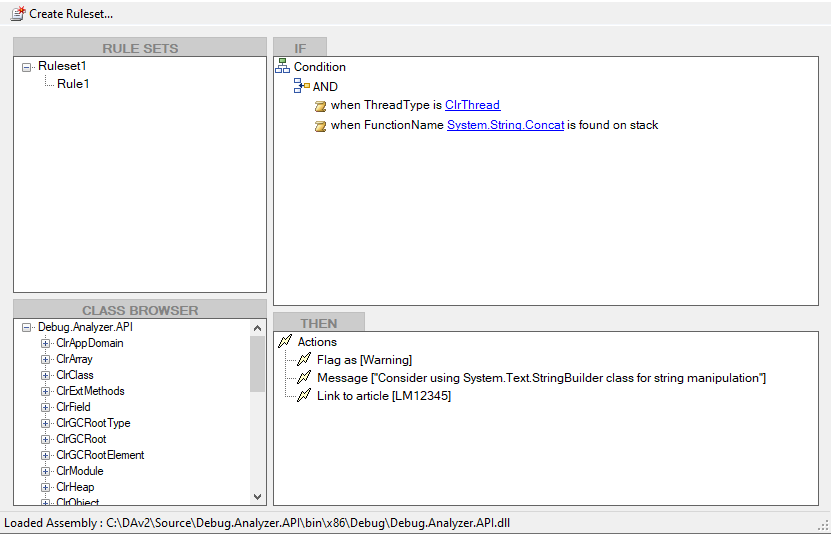
- Interactive Debugging : Ability to easily write Analysis commands just like Windbg but in .NET and do more…
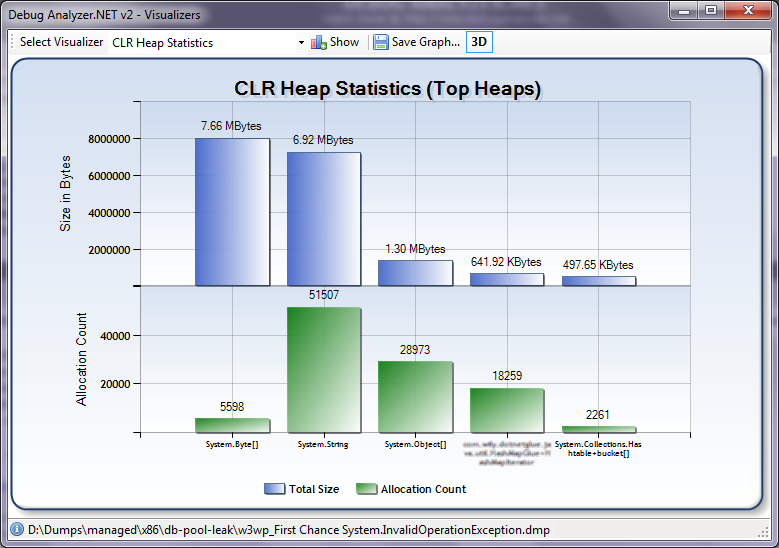
- Visualizers : Write Plug-in to Visualize the data into graphs, datagrids etc…
- Helpers : Plug-in UI which provides a way to write your own utility UX for other popular tools.
Ingredients:
- Plug Framework : Easy to build and use Plug-in model for writing analysis. For simplicity the plug-ins written for this Framework are called ‘Plugs’.
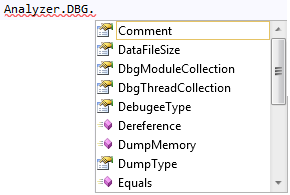
- Object Model : Easy to use Object Model which abstracts away complexities, extensible and which is also loosely coupled to tweak as and when required, against which the Plugs are written.
- Reporting Framework : Reporting framework which uses XML/XSL so that look and feel of the reports can be changed without touching the Plugs.
- Data Provider Model : Data Provider Model and framework for Data Extensibility and to make it easy to switch Data source by switching Data Access Component through config file
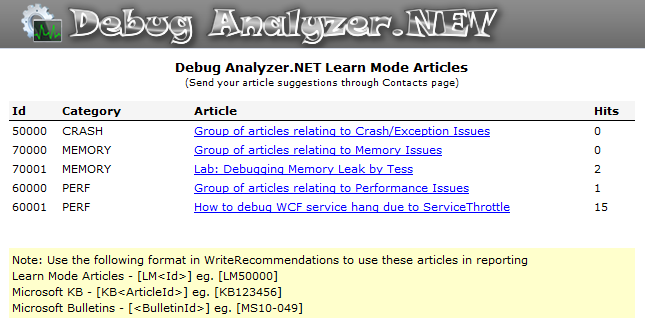
- Learn Mode : Where the analysis results provides more related resources which would explain how not to get into the same issue again.


Recent Comments